QuickVectorPlot(x, y, vx, vy, vscale, anObject) displays a 2D vector field defined over a 2D area.
- vx and vy may be a matrix or a string, a formula of the variables x and y.
- x (y) may be a matrix, an array of real (with sizes compatible with the size of vx and vy), a formula, a range, or 0.
- vscale specifies the size ratio for the arrows. If vscale is set to 1.0, vx and vy use the same scales as x and y, i.e. the scales shown by the axes. Enter a factor larger (smaller) than one to get larger (smaller) arrows.
Having the size of the arrows rescaled when you rescale the axes is natural in some circumstances, for example when you display velocity fields. If you want to specify a fixed size ratio in pixels per vx and vy unit, change the use view scaling property of the object.
set v to QuickVectorPlot(x, y, vx, vy, vscale, anObject)
set v's use view scaling to false
The script for the illustration is the script below.
set na to 40
set nr to 40
set a to creatematrix "x" ncols na nrows nr range {0, 2 * pi}
set r to creatematrix "y" ncols na nrows nr range {0, 3 * pi}
set fs to {"r*cos(a)", "r*sin(a)", "r*sin(a+r)", "r*cos(a-r)"}
set aors to evalformula fs with {a:a, r:r}
set {x, y, vx, vy} to ArrayToMatrix(aors, na, nr)
QuickVectorPlot(x, y, vx, vy, 0.1, 0)
Import script
|
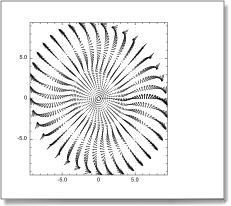
A vector plot for a field given in polar coordinates
|
