
QuickHistogram
|
|
Previous | Next | |
|
|
||
|
QuickHistogram
|
||
| Home ▸ Documentation ▸ SmileLab ▸ Scripting ▸ Making graphs by script ▸ QuickPlotLib ▸ QuickHistogram | ||
|
|
||
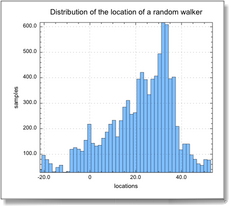
QuickHistogram(y, n, the_object) plots the histogram of the values stored in y (an array of real or a list of numbers), distributed into n categories. You will probably want to edit the graphical settings of the histogram, since the default settings make black bars with a black contour. Use the Information dialog (use the contextual menu to open the Information dialog), or proceed by script as shown below. |
|
set y to runningsum (randomarray 10000 range {-1, 1}) |
|
|
|
||
| Copyright ©2008 Paris, Satimage | ||