
QuickTriangulatedContour
|
|
Previous | Next | |
|
|
||
|
QuickTriangulatedContour
|
||
| Home ▸ Documentation ▸ SmileLab ▸ Scripting ▸ Making graphs by script ▸ QuickPlotLib ▸ QuickTriangulatedContour | ||
|
|
||
QuickTriangulatedContour(x, y, z, n, anObject) displays n contour lines for a scalar field defined by the values of z on the locations defined by x,y. x,y and z must be arrays of real with the same number of values.set n to 50 |
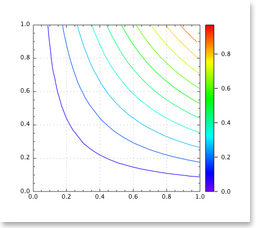 An interpolated contour |
|
|
||
| Copyright ©2008 Paris, Satimage | ||