
Gathering graphs in a window
|
|
Previous | Next | |
|
|
||
|
Gathering graphs in a window
|
||
| Home ▸ Documentation ▸ SmileLab ▸ Scripting ▸ Making graphs by script ▸ QuickPlotLib ▸ Gathering graphs in a window | ||
|
|
||
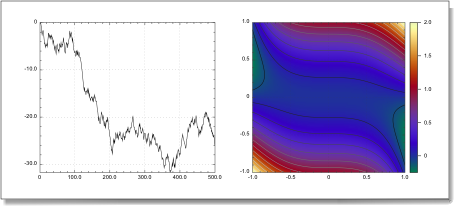
You can display several separate graphs in the same window. You must first prepare the graphic window by setting its grid property. grid is a list of two integers {i, j} which parts the page into j rows of i cells. In the example below we gather the examples of the previous pages in the same window (thus, the same PDF document when we save the window). |
|
set w to make new graphic window |
|
|
|
||
| Copyright ©2008 Paris, Satimage | ||