Using QuickPlotLib you can load new data into a graphic object after having created it. Just call again the same routine which created the object and provide a reference to it as the last argument. In the example below, we make a curve then we load new data into it.
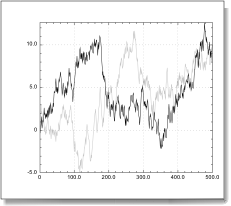
set y to runningsum (randomarray 500 range {-1, 1})
set c to QuickCurve(0, y, 0)
smilepause 2
set y2 to runningsum (randomarray 500 range {-1, 1})
QuickCurve(0, y2, c)
Import script
Here we insert a 2 secondes pause before replacing the data of the curve.
|
|
