on PlotOneCurve(f, v) -- f is the data file, v is the plot view where to create the curve
set {x, y} to extractcolumn {1, 2} in f skipping 1 as array of real
set c to make new curve at v with properties {xdata:x, ydata:y}
set properties of c to {pattern style:c, pen width:2, name:name of (info for f)} -- this is how to get a file's name
end PlotOneCurve
set f to (navchoose folder without multiple files) as alias -- you are asked to select a folder
set flist to list files f
set w to make new graphic window
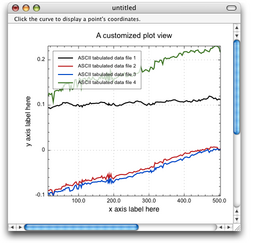
set properties of w to {margin:{0, 0}, message bar:"Click the curve to display a point's coordinates."}
set v to make new plot view at w
set properties of v to {legend kind:2, label text font:"Helvetica", label text size:14}
set properties of v to {xlabel:"x axis label here", ylabel:"y axis label here", name:"A customized plot view"}
repeat with i from 1 to (count flist)
set f to item i of flist
if (f as string) ends with ".txt" then
PlotOneCurve((get item i of flist), v)
end if
end repeat
draw w
Import script
|
|
