You can change the rendering of a data visualization graph using its settings window.
Open the settings window
To open a graph's settings window, bring to the front the graphic window where the graph belongs, then in the menu bar pull down the Graphs ▸ Edit settings sub-menu and select the view whose settings you want to edit.
Alternately, you can open the settings window by selecting Edit settings in the contextual menu (right-click or ctrl-click) of the plot.
Edit settings description
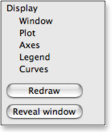
The Display section of the left pane
of SmileLab's plotting interface
The Graphic settings are part of SmileLab's plotting interface. You can access it thru the Display section of the left pane. It has
the following items: Window, Plot, Axes, Legend and Curves or 2D/3D objects. To select an item, click its name.
-
In the Window pane you can change the window's name and sizes and its background color.
-
In the Plot pane you can change plot labels (texts), plot styles (colors and fonts) and plot margins (its dimensions).
-
In the Axes pane you can change the axes' limits, you can select linear or log axes, and change all axes settings (ticks, grid, numbers format).
-
In the Legend pane (only relevant for curves) you set where to display the graph's legend.
-
In the last pane you edit settings which are specific to each kind of graph. For instance, if the graph concern curves, the last pane is Curves and you can change the settings for each curve (curve pattern, stroke width, etc.)
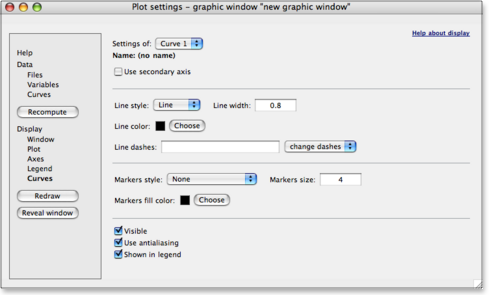
Curves settings in SmileLab's plotting interface
Overview of the graphic settings
Click the link below to open a new page that display an example of SmileLab's plotting interface. You can browse the interface panes by clicking in the left menu. All other behaviors (except help links) are disabled in this example.
Browse the settings interface corresponding to this example.
|

;)