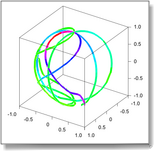
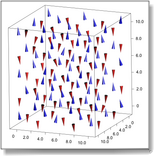
Satimage Previous | Next
3d graphs
Home Documentation SmileLab Gallery 3d graphs  
Simple surface. Simple surface with color scale.
Complex-valued field.
The color represents the complex phase.
Simple surface with gray scale.
3D scan of 1-euro coin. 3D triangle set of masked data.
Parametric surface.
Three data sets x(u,v), y(u,v), z(u,v) from a plasma physics simulation.
Solar corona physics.
A visualization of the seasons. Bubble.
A parametric surface with periodic boundary conditions.
A benzodiazepine.
A representation of a molecule, using SmileLab's 3d geometric objects (spheres).
Albedo map.
A color field mapped on a sphere.
3d curves.
The color represents the ozone concentration as measured by a satellite.
Spin configuration.
A vector field in a 3d domain, using SmileLab's 3d geometric objects (cones).
An isosurface of a 3D scalar field. 3d shape of a bar with straightness defects amplified.
A color field mapped on a torus. An isosurface representing a lobster.
Copyright ©2008 Paris, Satimage