Introduction
With Smile's graphic library, you can make a PDF drawing in a graphic window, or in a graphic view. The Overlay drawing contextual menu item of the graphic views is the simplest way to go to add comments or a graphic over a plot.
-
to define an overlay drawing to draw over the plot in a graphic view, pull down its contextual menu (ctrl-clic or right-click in the plot) then select Overlay drawing.
-
this opens a new window with the script of the graphic view, and installs a handler named on OverlayDrawing(v) which contains an example script, commented out. To program your graphic in the OverlayDrawing handler, you use directly the drawing commands, without encapsulating them with BeginFigure()...EndFigure().
-
the v parameter in the on OverlayDrawing(v) handler carries a reference to the graphic view. The graphic view contains data visualization objects - such as curves - which in turn contain data - for instance the xdata and ydata properties of a curve. To get the coordinates of the pixel for a given data point (given in user coordinates), use convert coordinates. The script provided as the example centers a text in the graphic view. To activate the example and have it draw over the graphic view, remove the (* and *), then save the window.
Example
Here is a more sophisticated example, which performs computations with a curve's data in order to number its vertices. The script calls a handler to compute the vertices (in user coordinates), then it uses convert coordinates to draw a circle around each vertex and to write a number close to it.
-
Define a curve:
set y to randomarray 20 range {0, 100}
set c to QuickCurve(0, y, "randomized values")
-
In the graphic view's contexutal menu, select Overlay drawing. Replace the default script with the following.
on getmaxs(x, y)
set n to (count y)
set {xl, yl} to {extractarray x at 1 for (n - 2), extractarray y at 1 for (n - 2)}
set {xc, yc} to {extractarray x at 2 for (n - 2), extractarray y at 2 for (n - 2)}
set {xr, yr} to {extractarray x at 3 for (n - 2), extractarray y at 3 for (n - 2)}
set m to evalformula "(yc > yl) & (yc > yr)" with {yl:yl, yc:yc, yr:yr}
set {xx, yy} to maskarray {xc, yc} with m
return {xx as list of real, yy as list of real}
end getmaxs
on OverlayDrawing(v)
try
set c to curve 1 of v
set {xx, yy} to getmaxs(xdata of c, ydata of c)
repeat with k from 1 to (count yy)
set xi to (get item k of xx)
set yi to (get item k of yy)
set {i, j} to convert coordinates {xi, yi} in v
SetPenColor({1, 0, 0, 0.9})
SetPenWidth(3)
MoveTo({i + 6, j})
ArcPath({i, j}, 6, 0, 2 * pi, true)
DrawPath(2)
TextMoveTo({i, j})
SetTextSize(15)
DrawString("[br]" & k)
end repeat
TextMoveTo({200, 50})
SetTextSize(12)
SetFillColor({0, 0, 0, 1})
DrawString("(" & (count yy) & " maximums)")
on error strErr
postit strErr
end try
end OverlayDrawing
Import script
|
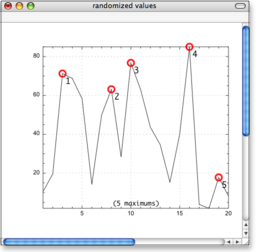
An overlay drawing over a curve
|
