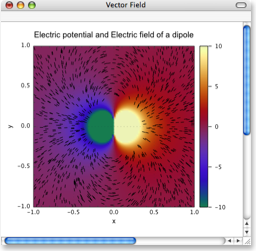
A graphic window may contain PDF graphics, graphics made by script, and SmileLab data visualization objects.
You can make a new graphic window by script, or by opening a file, or with the File ▸ New plot menu.
The contents of a graphic window may be saved to disk as a PDF file, as a bitmap image file, as a QuickTime movie file, or as a file in a format specific to Smile intended to store the whole graph's data.
When you click in a graphic window, its toolbar displays the coordinates of the mouse in pixel units (1 pixel = 1/72 inch). This is helpful to achieve custom page setups.
The graphic window supports a special mode, the edit mode, that you toggle on and off with the Edit ▸ Edit mode menu item. When the graphic window is in edit mode, you can resize its contents by dragging the bottom right corner.
|


