Introduction
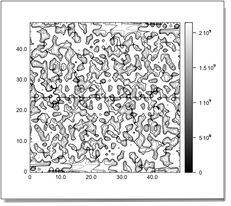
A contour map displays contour lines of a scalar field defined on a set of 2D points.
Providing the contour map with data
The rules for providing data to the contour map are strictly the same as for the scalar map.
- level number
- You must define the levels of the contour lines. To display contour lines with levels evenly spaced, specify the number of levels as the level number property. The levels will range within the interval defined as the limits property.
- levels
- Alternately, you can specify explicitly the list of the levels of the contour lines by providing a list of numbers as the levels property.
|
|
