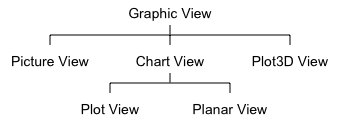
The graphic view, the virtual ancestor of all views
Smile's data visualization features rely on the graphic views. Any graphic view has to be an element of some graphic window. Smile cannot create a graphical view out of a graphic window.
make new picture view --> ERROR: Unknown object type
set w to make new graphic window
make new picture view at w -- correct
The graphic view class is an abstract class: you will not create nor use any graphic view, instead you will use the sub-classes of the graphic view. You will not either create nor use any chart view, this is a sub-class of graphic view which is in turn a virtual class.
The graphic views that you manipulate are the following:
- the picture view: displays static graphics
- the chart view : abstract class, ancestor of two following classes
- the plot view: plots curves for instance y=f(x)
- the planar view: plots data (scalar or vector fields) that are defined in a 2D space for instance (u(x,y), v(x,y))
- the view3D: plots 3D objects such as surfaces for instance (x(u,v), y(u,v), z(u,v)), 3D curves, triangles, quads, spheres, cylinders, etc.
All sub-classes of the graphic view understand the draw command, which refreshes the display of the object.
set w to make new graphic window
set v to make new picture view at w
-- more instructions
draw v -- refresh v only
draw w -- redraws the whole window
The coordinates
This section describes the conventions for the size and coordinates system in the graphic views. In the simplest cases, in particular if you use the QuickPlotLib library, the default settings of the graphs are satisfactory and you do not really need to know about the information below.
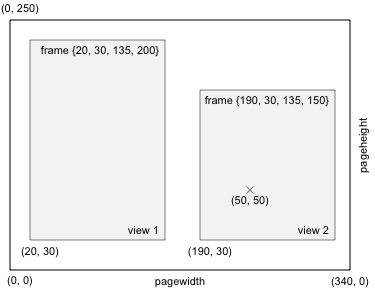
frame, the bounds of the graphics
The frames of the graphic objects: the unit for the frame property is one pixel, whose size is 1/72 inch.
The graphic view defines one rectangle, its frame property. A graphic view draws only inside its frame. The conventions for the frame, a list {x0, y0, dx, dy} in pixel units, are the same as for the graphic window.
In particular the PDF's that you may provide into the back pdf or the front pdf properties assume frame as their frame.
A given graphic view cannot produce any graphics out of its frame. Thus the frame should contain the axes, legends, labels, and the plot frame.
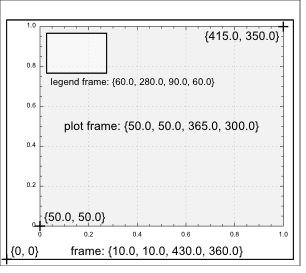
plot frame, the rectangle where data are plotted
The plot frames of the graphic views: the coordinates of the plot frame are relative to the view.
The sub-classes of the graphic views define, in addition to the frame discussed just above, a plot frame property. The plot frame is the rectangle inside which the view plots the data. In a plot view and in a planar view SmileLab maps the view's limits property (given in user's units) into the plot frame rectangle (in pixels). The convert coordinates command lets you use this mapping by script.
convert coordinates
convert coordinates will convert coordinates provided in user's units into coordinates in pixels relative to the graphic view's origin. Note that usually the graphic view's coordinates origin is not the graphic window's origin - see the section above.
set w to make new graphic window
set v to make new plot view at w
draw v
convert coordinates {0, 0} in v
-- {50.0, 50.0}
The fill color property allows for setting an rgba background color for the plot frame. This background can be transparent (if a=0).
In a view3D the plot frame is the rectangle onto which all the objects visible are projected.
|