|
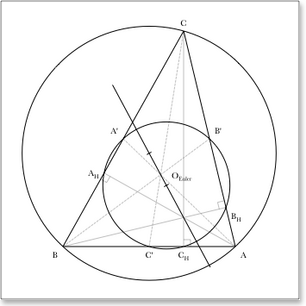
Etant donné un triangle, les points médians de chaque côté et les projections des sommets sur les côtés opposés appartiennent tous à un même cercle : le cercle d'Euler.
Ce script montre comment utiliser les fonctionnalités suivantes. Pour obtenir plus d'information sur un terme particulier, sélectionnez-le dans Smile et appuyez sur ⌘⇧F.
-
comment définir un point nommé : set a to {name:"A", point: [...],
-
comment afficher un point nommé à un endroit précis du graphique : {name:"O_m", hint:"rt"}, DrawPolygon, DrawName, markpoint,
-
comment marquer un angle droit : markrightangle,
-
quelques fonctions géométriques : circumcenter, project, barycenter, intersect.
|
Importer le script
set a to {name:"A", point:{3, 1.5}}
set b to {name:"B", point:{1, 1.5}}
set c to {name:"C", point:{2.4, 4}}
set tr to {a, b, c} --triangle
set cc to circumcenter (tr) & {name:"O_m", hint:"rt"}
set hs to {} --perpendicular
set ms to {} --medians
repeat with i from 1 to 3
set ll to (suppress item i from tr)
set pt to item i of tr
set end of hs to {point:project pt onto ll, endpoint:point of pt, name:(name of pt) & "_H"}
set end of ms to {point:barycenter ll, endpoint:point of pt, name:(name of pt) & "'"}
end repeat
set c9 to (circumcenter hs) & {name:"O_{Euler}", hint:"rt"}
set Oh to intersect {item 1 of hs, item 2 of hs}
set deuler to (line from {cc, Oh}) & {limits:{-0.9, 1.5}}
BeginFigure(0)
SetTextFont("Baskerville")
SetUserTransformation({100, 0, 0, 100, 0, 0})
SetCenter(barycenter (tr))
SetPenWidth(0.5)
SetPenGray({0.5, 1})
geompath hs
repeat with i from 1 to 3
markrightangle {item i of tr, item i of hs, item ((i mod 3) + 1) of tr} magnitude 8
end repeat
DrawPath(2)
SetDashPattern({0, 3, 1})
geompath ms
DrawPath(2)
SetPenWidth(1)
SetPenColor({0, 0, 0, 1})
SetDashPattern({})
geompath deuler
markpoint cc on deuler magnitude 3
markpoint c9 on deuler magnitude 3
DrawPolygon(tr)
geompath {cc, c9}
DrawPath(2)
DrawName(hs & ms)
EndFigure()
|
