Satimage Previous | Next
QuickScalarMap
Home Documentation SmileLab Scripting Making graphs by script QuickPlotLib QuickScalarMap  
QuickScalarMap(x, y, z, anObject) displays a color map of a scalar field. z may be either a matrix or a string, a valid formula of the x and y variables.
  • x and y may be the empty list {}: the x and y scales will assume the integer values if z is a matrix, or the range {0.0, 1.0} if z is a formula.
  • x and y may be a range {xmin, xmax}, or lists (or arrays of real) which let you provide arbitrary scales.
  • x and y can be themselves matrices which let you provide any 2D parametric set. For instance if the field is given in polar coordinates you provide the Cartesian coordinates x and y as matrices.
set sm to QuickScalarMap("2*pi*x*cos(2*pi*y)", "2*pi*x*sin(2*pi*y)", "cos(2*pi*x+10*pi*y)",0)

Import script

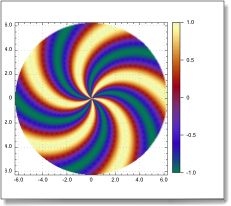
A color map in polar coordinates
Copyright ©2008 Paris, Satimage