QuickCurve(x, y, anObject) plots one curve y vs x.
-
If anObject is an existing curve, QuickCurve will load the new data in that curve.
-
If anObject is an existing plot view, QuickCurve will plot the data in a new curve in that plot view.
-
If anObject is an existing graphic window, QuickCurve will create a new plot view in that graphic window and it will plot the data in a new curve that it will create in that plot view.
-
If anObject is a wrong reference (for instance, an object that was disposed of) or 0 or a string, QuickCurve will make a new graphic window (with the string as its name if you provided a string), then a new plot view in that graphic window and it will plot the data in a new curve created in that plot view.
set c1 to QuickCurve(x1, y1, 0) -- new window, new plot view, new curve
set c2 to QuickCurve(x2, y2, c1's container) -- new curve in same plot view
QuickCurve(x3, y3, c1) -- new data in existing curve c1
-
The data are x and y. Normally they should be arrays of real or lists of numbers of identical size.
-
You can pass the empty list as x: QuickCurve will assume the integer values for x. Alternately you can pass a range as a list of two numbers {xmin, xmax}: QuickCurve will assume evenly distributed x values in that range.
QuickCurve({}, {0, 1, 4, 9, 16}, 0) -- x will automatically assume the values {0, 1, 2, 3, 4}
QuickCurve({0, 1}, {0, 1, 4, 9, 16}, 0) -- x will automatically assume the values {0, 0.25, 0.5, 0.75, 1}
|
-
You can also have QuickCurve plot formulae. To this effect, provide an expression of the x variable (a string) as the y parameter.
QuickCurve(x1, "x*sin(x)", 0) -- plot the formula in a new window
You can provide a range {xmin, xmax} for x.
QuickCurve({-pi, pi}, "x*sin(x)", 0) -- plot the formula for x in [-pi..pi]
|
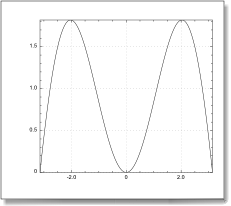
The plot of the function x.sin(x)
|
