Basic example
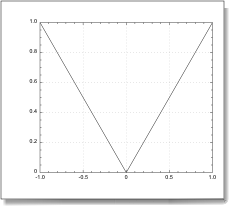
Let us plot a curve with three points (-1, 1), (0,0), and (1,1). As stated in the dictionary a curve must belong to a plot view, which in turn must belong to a graphic window. The example proceeds as follows: it first makes the objects, then it loads the data into the curve by setting its xdata and ydata properties, finally it requests Smile to draw the resulting graph.
set w to make new graphic window
set v to make new plot view at w
set c to make new curve at v
set c's xdata to {-1, 0, 1}
set c's ydata to {1, 0, 1}
draw w
Import script
|
|
