Moving and resizing graphs

|
Previous | Next | |
|
|
||
|
Moving and resizing graphs
|
||
| Home ▸ Documentation ▸ SmileLab ▸ SmileLab's interface ▸ Using the mouse ▸ Moving and resizing graphs | ||
|
|
||
The graphic window supports a special mode, the edit mode, that you toggle on and off with the Edit ▸ Edit mode menu item. When the graphic window is in edit mode, you can move and resize its page and the graphic views. |
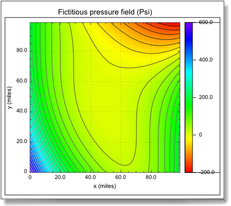
 The legend frame, the plot frame, the view's frame, and the window's frame, which is the PDF page. |
You can move the frames by dragging them with the mouse and you can resize them by dragging their bottom right corner. To move or resize a plot frame or a legend frame, you need to hold on the ⌘ (cmd) key pressed. When you adjust the sizes of the graphs (with the mouse or by script) we advise to follow a larger-to-smaller objects order. |
|
|
|
||
| Copyright ©2009 Paris, Satimage | ||