
Masking data in curves
|
|
Previous | Next | |
|
|
||
|
Masking data in curves
|
||
| Home ▸ Documentation ▸ SmileLab ▸ SmileLab's interface ▸ Using the mouse ▸ Masking data in curves | ||
|
|
||
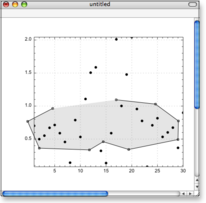
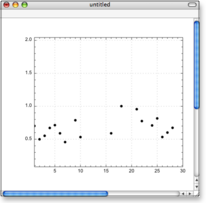
You can mask some data in a curve by using the mouse with the ⌥ key. When you hold the ⌥ key inside the plotting area (the plot frame) of a plot view, clicks draws a polygon. All points of all curves outside of this polygon will be masked. |
|
|
|
||
| Copyright ©2008 Paris, Satimage | ||