Description
The File ▸ New plot... menu open an interface to display as a graph the content of a data file.
The data file may be an ASCII file, a binary file, or some others specific kind of files. Depending on the kind of the data, you will make them into curves, color maps, contour maps, or surfaces.
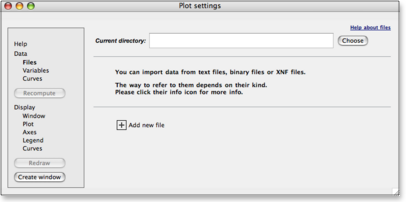
The Files panel of SmileLab's plotting interface for curves
You can import data from several files, optionally define intermediary computations, and make several visualization objects (for example, several curves or a scalar map and a contour map).
If you save a plot as bundle (SmileLab default file format) you can reopen it and access all its settings: for example you can plot other data files just by reopening your plot and changing its data files settings.
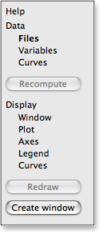
The left pane of
SmileLab's plotting interface
The interface is divided into two blocks: a menu on the left, and the corresponding pane on the right. There are contextual menu links in the right panes, and a Help item on the top of the left menu. The menu has two sections:
- the Data section to select files to import, specify computing sequences and define plots,
- the Display section to access plot and curves settings such as labels, colors and fonts...
Click on the left menu items of SmileLab's plotting interface to display the corresponding panes on the left-hand side.
Making a plot
Making a plot involves essentially three steps:
-
specify the files containing data to import in the Files panes and/or define formulas in the Variables panes,
-
define the plot in the last pane of the Data section using references to files and formulas specified in step 1,
-
create the window of the plot by clicking the Create Window button, or update the plot by clicking the Recompute button.
For more info about how to use SmileLab's plotting interface, please consult its help (click the first element of the left panel of the interface). This help includes some examples provided as a tutorial.
Examples
You can find some examples in the /Applications/Smile/SmileLab examples folder. You can open this folder from the Help ▸ SmileLab examples menu.
Those examples are bundles (i.e. SmileLab files) that you can open by double-clicking them or dropping them on Smile's icon. When you open such an example in Smile, you can access its settings by choosing Edit settings in its contextual menu, or by using the Graphs ▸ Edit settings menu. This opens SmileLab's interface relative to the plot.
Overview of SmileLab's plotting interface
Click the link below to open a new page that display an example of SmileLab's plotting interface. You can browse the interface panes by clicking in the left menu. All other behaviors (except help links) are disabled in this example.
Browse the plotting interface corresponding to this example.
|

;)