
Curves, scatter plots, and bar graphs

|
Previous | Next | |
|
|
||
|
Curves, scatter plots, and bar graphs
|
||
| Home ▸ Documentation ▸ SmileLab ▸ Gallery ▸ Curves, scatter plots, and bar graphs | ||
|
|
||
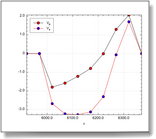
| Simple data plot. |
|
|
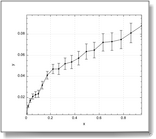
Data plot with error bars. |
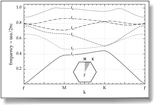
| The dispersion relation for a photonic crystal. Includes custom graphics. |
|
|
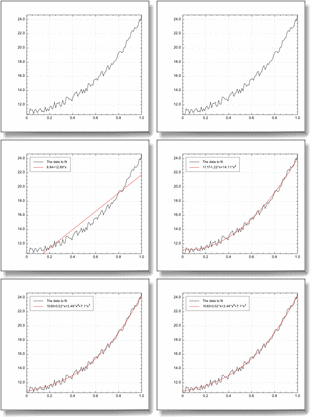
Plot with curve fit. |
|
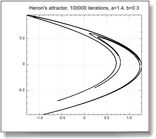
Scatter plot.
Henon's attractor (100,000 points). |
|
|
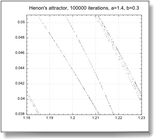
Scatter plot.
Henon's attractor (100,000 points), zoomed. |
|
Scatter plot.
Random number generator test. |

|
|
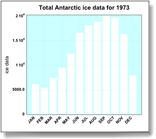
Bar graph.
Customized x axis. |
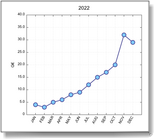
| Customized data plot. |
|

|
Animated plot.
The "comet effect". |
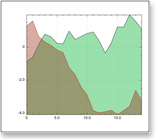
| Curves with fill color and transparency effects. |
|
|
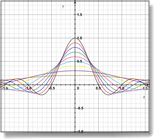
Customized plot. |
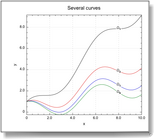
| Plot with legends on the curve. |
|
|
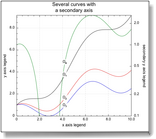
Plot with a secondary axis. |
|
File plotter.
An interactive data analysis tool. |
|||
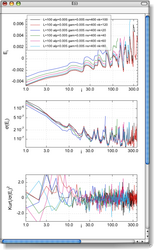
| Quantum physics simulation results. |
|
|
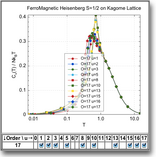
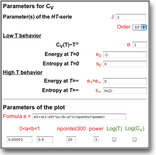
A web server provides physicists with the properties of custom spin lattice models. |
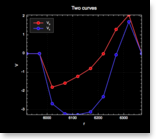
| Curves on a black background. |
|
||
|
|
||
| Copyright ©2008 Paris, Satimage | ||