Wrapping commands. All other graphic commands must be between a BeginFigure (or: BeginFrontFigure, BeginPDF, BeginContext) and a EndFigure (or: Endxxx) commands. Do not nest two such wrappers.
Wrappers
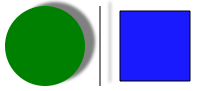
BeginFigure : Create a new graphic window or use an existing one, then start drawing in the window's background layer.
A drawing initiated with BeginFigure(w) must terminate with EndFigure() otherwise no output will occur.
BeginFigure(w)w : an existing graphic window, or 0 to draw in a new graphic window.
 Example
Create a new window and define the frame of the drawing.
See also the InitUserTransformation example.
set w to BeginFigure(0)
set {w's pagewidth, w's pageheight} to {200, 200}
CirclePath({100, 100}, 50)
DrawPath(2)
EndFigure()
EndFigure : Terminate the current drawing and generate the actual drawing
BeginFrontFigure : Create a new graphic window or use an existing one, then start drawing in the window's foreground layer.
A drawing initiated with BeginFrontFigure(w) must terminate with EndFrontFigure() otherwise no output will occur.
BeginFrontFigure(w)w : an existing graphic window, or 0 to draw in a new graphic window.
EndFrontFigure : Terminate the current drawing and generate the actual drawing
BeginPDF : Create a new empty PDF stream with the given dimensions.
A drawing initiated with BeginPDF() must terminate with EndPDF() in order to close the PDF stream.
BeginPDF(aRect)aRect : a list of 4 real numbers {originX, originY, width, height} which define a rectangle in pixels (1/72'')
EndPDF : Terminate the current drawing and generate the PDF stream. The result is a string containing a PDF page: you can save it as a PDF file or display it in Smile.
BeginContext : Make persistent all definitions of named objects created with BeginPath, BeginPattern, BeginGroup, Turbulence, or FractalNoise, by adding the named objects to the graphical context of w or to the application's global graphical context (w=0.) Do not use inside any BeginFigure ... EndFigure wrapper.
BeginContext(w)w : an existing graphic window or graphic view, or 0.
EndContext : Terminate the current drawing and adds the definitions to the graphical context concerned.
Context settings commands.
To restore the context settings to a previous state, use the SaveState … RestoreState commands.
Context handling
SaveState : Retains the current graphical settings.
RestoreState : Restores the graphical settings latest saved with SaveState()
Transformations
SetTransformation : Apply the linear transformation to all points used next. The transformation maps {x, y} into {a.x + c.y + tx, b.x + d.y + ty} (rotation, then translation.)
Use SetTransformation() with SaveState() and RestoreState().
Initially dimensions in the graphic commands are given in pixels (1/72''.) 'SetTransformation' will affect all dimensions, including e.g. stroke thicknesses (see example.)
Successive calls to SetTransformation compose transformations. To revert to the transformation as it was before the SetTransformation call, wrap the call between 'SaveState()' and 'RestoreState()'.
SetTranslation(x,y), SetRotation(theRad) and SetScale(theScale) are simplified functions similar to SetTransformation.
SetTransformation({a, b, c, d, tx, ty})ExampleNotice the relative positions of DrawPath and RestoreState: in the second case, the transformation does not apply to the pen width.
BeginFigure(0)
SetPenColor({0.1, 0.1, 1})
SaveState()
SetTransformation({25.0, 12.5, 12.5, 25.0, 50.0, 50.0})
CirclePath({0, 0}, 1)
DrawPath(2)
RestoreState()
SaveState()
SetTransformation({25.0, 12.5, 12.5, 25.0, 120.0, 50.0})
CirclePath({0, 0}, 1)
RestoreState()
DrawPath(2)
EndFigure()
SetUserTransformation : Like SetTransformation, but the transformation only applies to the 2D points that the user defines: {x, y} gets changed into {a.x + c.y + tx, b.x + d.y + ty}.
Thus, unlike SetTransformation, SetUserTransformation does not affect the sizes such as stroke thicknesses.
The transformation that SetUserTransformation defines composes with the transformation (possibly) defined by SetTransformation.
To revert to the transformation as it was before the SetTransformation call, wrap the call between 'SaveState()' and 'RestoreState()'.
SetUserTranslation(x,y), SetUserRotation(theRad) and SetUserScale(theScale) are simplified functions similar to SetUserTransformation.
SetUserTransformation({a, b, c, d, tx, ty})ExampleCompare with the preceding example: SaveState...RestoreState encapsulation is not needed any more to have an unscaled pen width.
BeginFigure(0)
SetUserTransformation({25.0, 12.5, 12.5, 25.0, 40.0, 35.0})
CirclePath({0, 0}, 1)
SetPenColor({0, 0.5, 0})
DrawPath(2)
SetUserTranslation(2.0, -1)
CirclePath({0, 0}, 1)
SetPenColor({0.1, 0.1, 1})
DrawPath(2)
EndFigure()
Colors
SetFillColor : Sets the current fill color to rgba (red, green, blue, alpha.)
{0, 0, 0, 1} is black, {1, 0, 0, 1} is red.
SetFillColor(rgba)rgba : a list of 4 numbers in [0..1]. 'a' is the opacity (optional.)
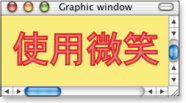
ExampleThe fill color affects text as well as the shapes. By default the text mode is 0 (fill only) and the color of the text is the color specified by SetFillColor.
BeginFigure(0)
SetPenWidth(5)
SetPenColor({0, 0, 1})
SetFillColor({1, 0, 1})
TextMoveTo({110, 100})
SetTextFont("Arial")
SetTextSize(250)
SetTextMode(2) -- text mode 2 = fill + stroke
DrawString("[h]A")
EndFigure()
SetFillGray : Sets the current fill color to the gray level specified by g.
SetFillGray(g)g : a real in [0..1], or a list {g, alpha}.
SetFillCMYK : Sets the current fill color to cmyka.
{0, 0, 0, 1, 1} is black, {1, 0, 0, 0, 1} is cyan.
SetFillCMYK(cmyka)cmyka : a list of 5 real numbers {cyan, magenta, yellow, black, alpha} in [0..1]. 'alpha' is the opacity (optional.)
SetPenColor : Sets the current pen color to rgba.
{0, 0, 0, 1} is black, {1, 0, 0, 1} is red.
SetPenColor(rgba)rgba : a list of 4 numbers in [0..1]. 'a' is the opacity (optional.)
SetPenGray : Sets the current pen color to the gray level specified by g.
SetPenGray(g)g : a real in [0..1], or a list {g, alpha}.
SetPenCMYK : Sets the current pen color to cmyka.
{0, 0, 0, 1, 1} is black, {1, 0, 0, 0, 1} is cyan.
SetPenCMYK(cmyka)cmyka : a list of 5 real numbers {cyan, magenta, yellow, black, alpha} in [0..1]. 'alpha' is the opacity (optional.)
Strokes
SetLineCap : Sets the style for the endpoints of lines.
SetLineCap(lc)lc : 0 = no cap, 1 = round cap, 2 = square cap
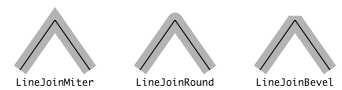
SetLineJoin : Sets the style for the join of connected lines.
SetLineJoin(lj)lj : 0 = miter (sharp joint), 1 = round joint, 2 = bevel
SetMiterLimit : Sets the miter limit for the join of connected lines.
SetMiterLimit(ml)ml : a length in pixels (1/72'')
SetPenWidth : Sets the pen width to theSize (scaled according to the current transformation, if one was defined.)
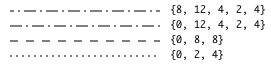
SetDashPattern : Sets the dash for strokes.
thePat: a list of an odd number of real numbers {start_pix, stroke_1, space_1, stroke_2, space_2, ...} defining the dash pattern, or the empty list {} to reset to no dash.
stroke_n, space_n must occur by pairs. They describe (in pixels) the lengths of the successive segments and spaces between segments. start_pix is the starting pixel in the pattern, for instance if start_pix is stroke_1 + space_1 the stroke will start with the second segment.
Ex: {0, 2, 3, 10, 3} makes a point-dash pattern.
SetDashPattern(thePat)Exampleset dashes to {{0,2,4}, {0,8,8}, {0,12,4,2,4}, {8,12,4,2,4}}
BeginFigure(0)
SetUserTranslation(10, 10)
repeat with d in dashes
SetDashPattern(d)
MoveTo({0, 0})
LineTo({150, 0})
DrawPath(2)
TextMoveTo({160, -2})
DrawString(display d)
SetUserTranslation(0, 15)
end repeat
EndFigure()
Path commands. End a path with DrawPath to have it drawn.
Paths handling
DrawPath : Terminates the current path and makes it into a graphic. DrawPath uses the current pen and fill settings. Two successive paths with different pen or fill settings require two calls to DrawPath.
Drawpath provides two fill rules: "fill" fills the areas with a positive total winding number, while "eofill" fills the areas with an odd (positive or negative) total winding number (cf ArrowPath's example). A given point's winding number is computed as the number of paths which wind around it counter-clockwise, minus the number of those which go clockwise.
DrawPath(n)n : 0 (or "fill") = fill, 1 (or "eofill") = evenoddfill, 2 (or "stroke") = stroke, 3 (or "fill-stroke") = fillstroke, 4 (or "eofill-stroke") = evenoddfillstroke
ExampleSee also the ArrowPath example about winding numbers.
BeginFigure(0)
SetUserTransformation({30, 0, 0, 30, 35, 35})
SetPenColor({0.1, 0.1, 1})
SetFillColor({0, 0.5, 0})
SetPenWidth(3)
repeat with i from 0 to 4
CirclePath({0, 0}, 0.3)
CirclePath({0, 0}, 0.6)
CirclePath({0, 0}, 1)
DrawPath(i)
SetUserTranslation(2.5, 0)
end repeat
EndFigure()
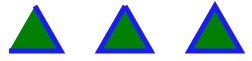
ClosePath : Adds to the current path a line from its last point to its first point.
ClosePath()Examplethe second triangle is not closed by ClosePath: its top vertex is not well displayed.
set {a,b,c} to {{0,1}, {(sin pi/3),-0.5}, {-1*(sin pi/3),-0.5}}
BeginFigure(0)
SetUserTransformation({30, 0, 0, 30, 35, 25})
SetPenColor({0.1, 0.1, 1})
SetFillColor({0, 0.5, 0})
SetPenWidth(5)
MoveTo(a)
LineTo({b, c})
DrawPath(3)
SetUserTranslation(3, 0)
MoveTo(a)
LineTo({b, c, a})
DrawPath(3)
SetUserTranslation(3, 0)
MoveTo(a)
LineTo({b, c})
ClosePath()
DrawPath(3)
EndFigure()
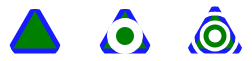
ClipPath : Restricts drawing to the intersection of the current clip region with the current path.
There is no command to reset the clipping region so you must use "ClipPath" with "SaveState" and "RestoreState".
ClipPath(n)n : 0 (or "fill") = fill, 1 (or "eofill") = evenoddfill, 2 (or "stroke") = stroke
Exampleset {a,b,c} to {{0,1}, {(sin pi/3),-0.5}, {-1*(sin pi/3),-0.5}}
BeginFigure(0)
SetUserTransformation({30, 0, 0, 30, 35, 25})
SetPenColor({0.1, 0.1, 1})
SetFillColor({0, 0.5, 0})
SetPenWidth(5)
repeat with i from 0 to 2
SaveState()
CirclePath({0, 0}, 0.3)
CirclePath({0, 0}, 0.6)
CirclePath({0, 0}, 0.9)
ClipPath(i)
MoveTo(a)
LineTo({b, c})
ClosePath()
DrawPath(3)
RestoreState()
SetUserTranslation(3, 0)
end repeat
EndFigure()
Creating paths
MoveTo : Sets the current pen position to thePt.
MoveTo(thePt)thePt : a pair {x,y}
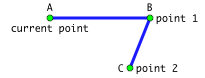
LineTo : Appends to the current path a line from the current point to a new point, or appends a broken line.
LineTo(thePt)thePt : a pair {x,y} or a list of such.
Exampleset {a, b, c} to {{0, 0}, {1, 0}, {0.8, -0.5}}
BeginFigure(0)
SetUserTransformation({100, 0, 0, 100, 50, 60})
SetPenColor({0.1, 0.1, 1})
SetPenWidth(3)
MoveTo(a)
LineTo({b, c})
DrawPath(2)
EndFigure()
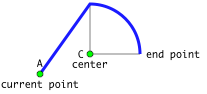
ArcPath : Adds an arc of circle to the current path, possibly preceded with a line segment.
ArcPath(theCenter, theRadius, rad1, rad2, clockw)theCenter : center of the arc,
theRadius : radius,
rad1 : starting angle (radian),
rad2 : ending angle (radian),
clockw : boolean: true draws clockwise.
Exampleset {a, c} to {{40, 20}, {90, 40}}
BeginFigure(0)
SetPenWidth(3)
SetPenColor({0.1, 0.1, 1})
MoveTo(a)
ArcPath(c, 50, pi / 2, 0, true)
DrawPath(2)
EndFigure()
ArcToPointPath : Adds an arc of circle to the current path, possibly preceded with a line segment, so as to produce a smooth angle at ctrlPt.
theRadius is the radius of the arc.
The arc is tangent to the line from the current point to ctrlPt and to the line from ctrlPt to endPt.
ArcToPointPath(ctrlPt, endPt, theRadius)Exampleset {a, b, c} to {{0, 0}, {1, 0}, {0.8, -0.5}}
BeginFigure(0)
SetUserTransformation({100, 0, 0, 100, 50, 60})
SetPenColor({0.1, 0.1, 1})
SetPenWidth(2)
MoveTo(a)
ArcToPointPath(b, c, 0.2)
DrawPath(2)
EndFigure()
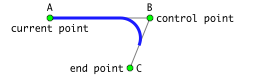
QuadBezierPath : Appends to the current path a quadratic Bezier curve from the current point to endPt with ctrlPt as the control point.
QuadBezierPath(ctrlPt, endPt)Exampleset {a, b, c} to {{0, 0}, {1, 0}, {0.8, -0.5}}
BeginFigure(0)
SetUserTransformation({100, 0, 0, 100, 50, 60})
SetPenColor({0.1, 0.1, 1})
SetPenWidth(2)
MoveTo(a)
QuadBezierPath(b, c)
DrawPath(2)
EndFigure()
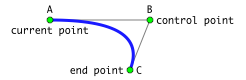
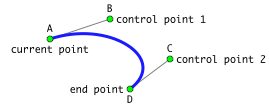
BezierPath : Appends to the current path a cubic Bezier curve from the current point to endPt with ctrlPt1 and ctrlPt2 as the control points.
BezierPath(ctrlPt1, ctrlPt2, endPt)Exampleset {a,b,c,d} to {{0,0}, {0.6,0.2}, {1.2,-0.2}, {0.8,-0.5}}
BeginFigure(0)
SetUserTransformation({100, 0, 0, 100, 50, 70})
SetPenColor({0.1, 0.1, 1})
SetPenWidth(2)
MoveTo(a)
BezierPath(b, c, d)
DrawPath(2)
EndFigure()
Raccourcis
DMove : moves the current pen position by theOffset.
DMove(theOffset)theOffset : a pair {dx,dy}
DLine : Appends to the current path a line equal to a the vector theOffset.
DLine(theOffset)theOffset : a pair {dx,dy}
RectPath : Appends to the current path a rectangular path.
RectPath({x0, y0, theWidth, theHeight})
RoundRectPath : Appends to the current path a rounded rectangular path.
RoundRectPath(r, theRadius)r : {x0, y0, theWidth, theHeight}, the rectangle
theRadius : the radius of the rounds
PolyLine : Draws a broken line from the first point of thePtList passing by the other points of thePtList.
PolyLine(thePtList)thePtList : a list of points (or pairs {x,y})
ExamplePolyLine is faster than drawing point after point. In this example, SetTransformation is used to shift the origin of the drawing: here we take the center of the page as the origin of the coordinates.
set npts to 86
set w to BeginFigure(0)
SetPenColor({1, 0.2, 0.2})
SetPenWidth(0.5)
set pts to {}
set {i, j, di, dj} to frame of w
SetTransformation({1, 0, 0, 1, di / 2, dj / 2})
repeat with n from 0 to npts
set r to di * 0.45 * n / npts
set end of pts to {r * (cos r), r * (sin r)}
end repeat
PolyLine(pts)
DrawPath(2)
EndFigure()
CirclePath : Appends to the current path a circle with the specified center and radius.
CirclePath(theCenter, theRadius)
CircleArcPath : Adds an arc of circle to the current path, like ArcPath(), but without the straight line segment.
CircleArcPath(theCenter, theRadius, rad1, rad2, clockw)theCenter : center of the arc,
theRadius : radius,
rad1 : starting angle (radian),
rad2 : ending angle (radian),
clockw : boolean: true draws clockwise.
EllipsePath : Adds an ellipse to the current path.
EllipsePath(r)r : {x0, y0, theWidth, theHeight}, the rectangle containing the ellipse
CurveTo : Appends to the current path a smooth line from the current point passing by a list of new points.
CurveTo(theListOfPts)theListOfPts : a list of points (or pairs {x,y})
ClosedCurve : Appends to the current path a closed smooth line passing by the list of points.
ClosedCurve(theListOfPts)theListOfPts : a list of points (or pairs {x,y})
Text commands.
Settings
SetTextFont : Sets the text font.
SetTextFont(theFont)theFont : a string
SetTextSize : Sets the text size.
SetTextSize(theSize)theSize : an integer
SetTextOffset : Sets the offsets that will be applied when using positional parameters with "DrawString()". Please note: the graphic window keeps internally the text offsets.
SetTextOffset(xOffset, yOffset)xOffset : horizontal offset (default: 6)
yOffset : vertical offset (default: 4)
SetTextSpacing : Sets the text spacing, in pixels.
SetTextSpacing(theSize)theSize : a real number (default: 0)
TextMoveTo : Sets the current text position to thePt.
TextMoveTo(thePt)thePt : a pair {x,y}
SetTextMode : Defines the text drawing mode.
SetTextMode(theMode)theMode : 0 = Fill, 1 = Stroke, 2 = FillStroke, 3 = Invisible, 4 = FillClip, 5 = StrokeClip, 6 = FillStrokeClip, 7 = Clip
Writing text
Text utilities commands can be found in the Misc section of this dictionary, and in the >Smile text suite section of Smile's dictionary.
DrawText : Draws a string at the current text position using the current text settings and the current linear transformation.
DrawString : Draws a string at the current text position using the current text settings and the current linear transformation.
Same as DrawText except that DrawString supports a positional parameter in theString and latex keywords.
The displayed string can begin with a positional hint: "[h]" (center), "[t]" (top), "[b]" (bottom), "[r]" (right), "[l]" (left) or "[tr]", "[tl]", "[br]", "[bl]"
Image commands.
Image import
DrawImage : Draws an image stored as a file (locally or remotely), or a texture reference (defined with Turbulence or FractalNoise), or a reference defined with LoadImage or BeginImage.
DrawImage(theImage, r, preserveAspectRatio)theImage : a reference to a file, a URL, or a named texture
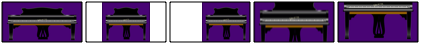
r : a list of numbers {x,y} or {x, y, width, height}. If r is a list of 2 numbers {x, y}, the picture's bottom left corner assumes r as its location, and DrawImage draws the picture at scale 1. If r is a list of 4 numbers {x, y, width, height} DrawImage will fit the picture into the rectangle r, according to the rules specified by preserveAspectRatio (a string.)
preserveAspectRatio : "" or a string “xPOSyPOS meetOrSlice” where POS may be Min, Mid ou Max, and meetOrSlice may be meet or slice. If preserveAspectRatio is the empty string "", the image will fit exactly the rectangle, otherwise DrawImage preserves the aspect ratio. “meet” scales so that the image is fully inside the rectangle (which may leave white margins). slice leaves no margin, but may crop the image. For example, “xMaxyMin slice” will allow truncating, either the left, or the top, of the image.
Exampleset pianoFile to "http://www.satimage.fr/software/images/piano.png"
BeginFigure(0)
set r to {2, 2, 80, 40}
set t to {1, 0, 0, 1, 84, 0}
set ls to {"", "xMidYMid meet", "xMaxYMid meet", "xMidyMid slice", "xMidYMin slice"}
repeat with s in ls
RectPath(r)
DrawImage(pianoFile, r, s)
DrawPath(2)
SetTransformation(t)
end repeat
EndFigure()
LoadImage : Load an image into memory. Useful when an image has to to drawn several times.
LoadImage(theName, theImage)theName : a name associated to the image. The reference for DrawImage is this name preceded with a character #.
theImage : a reference to a file
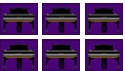
Exampleset pianoFile to "http://www.satimage.fr/software/images/piano.png"
set {pixel width:x, pixel height:y} to image info for pianoFile
set {x, y} to divlist {x, y} with 4
set w to BeginFigure(0)
set background color of w to {1, 1, 1, 0}
LoadImage("piano", pianoFile)
repeat with i from 0 to 2
repeat with j from 0 to 1
DrawImage("#piano", {i * (x + 5), j * (y + 5), x, y}, "")
end repeat
end repeat
EndFigure()
DrawPDF : Draws the page thePage of a PDF document (local or remote). NB: to get the mediabox of an existing PDF file, use the 'pdf boxes' command of Smile.
DrawPDF(thePDF, r, preserveAspectRatio, thePage)thePDF : a reference to a file, or a URL
r : a list of numbers {x,y} or {x, y, width, height}. If r is a list of 2 numbers {x, y}, the picture's bottom left corner assumes r as its location, and DrawPDF draws the picture at scale 1. If r is a list of 4 numbers {x, y, width, height} DrawPDF will fit the picture into the rectangle r, according to the rules specified by preserveAspectRatio (a string.)
preserveAspectRatio : "" or a string “xPOSyPOS meetOrSlice” where POS may be Min, Mid ou Max, and meetOrSlice may be meet or slice. If preserveAspectRatio is the empty string "", the image will fit exactly the rectangle, otherwise DrawPDF preserves the aspect ratio. “meet” scales so that the image is fully inside the rectangle (which may leave white margins). slice leaves no margin, but may crop the image. For example, “xMaxyMin slice” will allow truncating, either the left, or the top, of the image.
thePage : an integer
Creation and masking
ClipToImage : Restricts drawing to an area defined from an image. There is no command to reset the clipping image so you must use "ClipToImage" with "SaveState" and "RestoreState".
ClipToImage(r,r, theImage)r : a rectangle {x, y, width, height}: the clipping area
theImage : an image file or a reference to an image defined with LoadImage or BeginImage. If this is a color image, it is translated into a gray scale image. Then the gray level of each pixel is used as an alpha value for the following drawings. If the image is a mask (made with BeginImage using the "mask" type") then the alpha values are reversed: blank pixels (value 1) will result in a transparent drawing.
BeginImage : All the drawing orders between BeginImage(theName, theSize, theType) and EndImage() will be used to define an image whose name will be theName.
BeginImage(theName, theSize, theType)theName : name of the image; the reference to this image is its name preceded by #. Ex: DrawImage("#" & theName,…)
theSize : a list {width, height} : the image dimensions
theType : a string: "mask" or "gray" or "rgb"
LoadImageWithColorMask : Create a new image by filtering the colors of the source image with a range of rgb values.
LoadImageWithColorMask(theName, theImage, colorMask)theName : name of the resulting image; the reference to this image is its name preceded by #. Ex: DrawImage("#" & theName,…)
theImage : a image file or a reference to an image
colorMask : a list of real between 0 and 1 : {rmin, rmax, gmin, gmax, bmin, bmax}
Textures
FractalNoise : Makes a named fractal texture using the Perlin's function. To draw the texture, use DrawImage. r is the texture's boundaries. theTile is a boolean: when true, the texture is periodic. freq, a list of two numbers, is the x- and y-frequencies. numOctaves is the (integer) number of scales used in the texture. theOffsets and theColors define the color gradation as described for LinearGradient.
FractalNoise(theName, r, freq, theTile, numOctaves, theOffsets, theColors)theName : a string
r : a rectangle {x, y, width, height}
freq : a list of numbers {fx, fy}
theTile : a boolean
numOctaves : a positive integer
theOffsets : n increasing numbers in [0..1]
theColors : n rgba colors (rgba is a list of 3 or 4 numbers)
Example BeginFigure(0)
set offsets to {0, 0.4, 1}
set colors to {{1, 1, 1}, {0.4, 0.4, 1}, {0.3, 0.3, 1}}
FractalNoise("turb", {30,0,100,100}, {0.01,0.015}, true,6, offsets, colors)
DrawImage("#turb", {0, 0, 100, 100}, "xMidYMid slice")
EndFigure()
Turbulence : Like FractalNoise, but makes a turbulent, instead of fractal, texture.
Turbulence(theName, r, freq, theTile, numOctaves, theOffsets, theColors)
LinearGradient : Makes a color gradation in the direction from pt1 to pt2. theOffsets and theColors are two lists which define the gradation.
In the direction orthogonal to the direction pt1-pt2, the color has no limit. Thus it is usual to use LinearGradient after having defined a clipping region with ClipPath.
LinearGradient(pt1, pt2, theOffsets, theColors, extendStart, extendEnd)pt1 : a pair {x1, y1}
pt2 : a pair {x2, y2}
theOffsets : a list of numbers increasing from 0 to 1 {x0=0, x1, ... xn=1}
theColors : a list of colors {c0, c1, ... cn}. The gradation along the segment p1-p2 assumes the piecewise linear function that the lists define, where x0=0 stands for pt1 and xn=1 stands for pt2.
extendStart : boolean: does the color extend beyond the start point pt1?
extendEnd : boolean: does the color extend beyond the end point pt2?
ExampleBeginFigure(0)
SaveState()
RectPath({10, 10, 200, 50})
ClipPath(0)
LinearGradient({10,10}, {210,10}, {0,1}, {{0.1,0.1,1,1}, {0,0,0,1}}, true, true)
RestoreState()
EndFigure()
RadialGradient : Like LinearGradient, but the gradation occurs from a circle (center pt1, radius r1) to another circle (center pt2, radius r2).
RadialGradient(pt1, r1, pt2, r2, theOffsets, theColors, extendStart, extendEnd)pt1 : a pair {x1, y1}
r1 : a positive number
pt2 : a pair {x2, y2}
r2 : a positive number
theOffsets : n increasing numbers in [0..1]
theColors : n rgba colors (rgba is a list of 3 or 4 numbers)
extendStart : boolean: does the color extend inside r1?
extendEnd : boolean: does the color extend outside r2?
ExampleBeginFigure(0)
SaveState()
set r to {5, 5, 200, 50}
set offsets to {0, 0.8, 1}
set colors to {{0, 0.5, 0}, {0.1, 0.1, 1, 1}, {0, 0, 0}}
RectPath(r)
ClipPath(0)
set {pt1, pt2} to {{40, 30}, {105, 30}}
RadialGradient(pt1, 10, pt2, 80, offsets, colors, false, false)
RestoreState()
SetTransformation({1, 0, 0, 1, 205, 0})
SaveState()
RectPath(r)
ClipPath(0)
RadialGradient(pt1, 10, pt2, 80, offsets, colors, true, true)
RestoreState()
EndFigure()
Creating
BeginLayer : To apply a transparency mode (SetAlpha) or a shadowing mode (SetShadow) to a whole graphic rather to each of its elements separately, encapsulate the drawing with BeginLayer() ... EndLayer().
BeginLayer() resets the opacity to 1 and suppresses any shadow. EndLayer() restores the opacity and shadowing mode to their previous values.
EndLayer : Realize the graphical commands since the latest BeginLayer, applying any shadow and / or transparency setting. EndLayer() restores the opacity and shadowing mode to their previous values.
Special effects
SetShadow : Toggles the current state to produce a shadow. Subsequent drawing commands (DrawPath etc.) produce shadowed graphics. To apply SetShadow to a drawing as a whole rather than to each of its elements separately, use BeginLayer() ... EndLayer().
To terminate drawing shadows, specify the empty list {} as rgba.
SetShadow(thePt, blur, rgba)thePt : a list of two numbers (the offset for the shadow)
blur : a real number (the blur's amplitude)
rgba : a list of 3 or 4 real numbers in [0..1]. 'a' is the opacity (default: 1/3)
ExampleBeginFigure(0)
SetShadow({10, 5}, 3, {0.5, 0.5, 0.5, 1})
CirclePath({45, 45}, 40)
SetPenColor({0, 0, 0})
SetFillColor({0, 0.5, 0})
DrawPath(0)
MoveTo({100, 5})
LineTo({100, 85})
DrawPath(2)
SetShadow({5, 5}, 3, {})
RectPath({120, 10, 70, 70})
SetFillColor({0.1, 0.1, 1, 1})
DrawPath(3)
EndFigure()
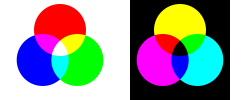
SetAlpha : The opacity of subsequent graphic commands is multiplied by a. To apply transparency to a drawing as a whole rather than to each of its elements separately, use BeginLayer() ... EndLayer().
SetAlpha(a)a : a real in [0..1] (0: transparent, 1: opaque)
ExampleBeginFigure(0)
BeginGroup("Circles")
CirclePath({40, 30}, 30)
SetFillColor({0.1, 0.1, 1})
DrawPath(0)
CirclePath({80, 30}, 30)
DrawPath(0)
EndGroup()
BeginGroup("Rect")
RectPath({5, 10, 110, 40})
SetFillColor({0, 0.8, 0})
DrawPath(3)
EndGroup()
SaveState()
UseReference("Rect")
SetAlpha(0.5)
UseReference("Circles")
RestoreState()
SetUserTranslation(120, 0)
UseReference("Rect")
SetAlpha(0.5)
BeginLayer()
UseReference("Circles")
EndLayer()
EndFigure()
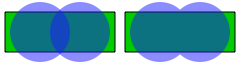
SetBlendMode : Modify the rendering of superposed colors. For instance, the mode "multiply" multiply each rgb component of the background and of the new drawings. The normal mode (0) does nothing; it cancels any current blend mode.
SetBlendMode(blendmode)blendmode : un nombre entier dans 0..15. 0 normal, 1 multiply, 2 screen, 3 overlay, 4 darken, 5 lighten,
6 colorDodge, 7 colorBurn, 8 softLight, 9 hardLight, 10 difference, 11 exclusion, 12 hue, 13 saturation, 14 color, 15 luminosity
Exampleset r to 20
BeginFigure(0)
SetUserTransformation({r, 0, 0, r, 3 * r, 2.5 * r})
SetBlendMode(2)
set centers to {{0, 1}, {(sin pi / 3), -0.5}, {-1 * (sin pi / 3), -0.5}}
set colors to {{1, 0, 0}, {0, 1, 0}, {0, 0, 1}}
repeat with i from 1 to 3
SetFillColor(item i of colors)
CirclePath(item i of centers, 1.3)
DrawPath(0)
end repeat
SetBlendMode(0)
set colors to {{1, 1, 0}, {0, 1, 1}, {1, 0, 1}}
SetUserTranslation(6, 0)
SetFillColor({0, 0, 0})
set x to -2.5
RectPath({-x, -x, 2 * x, 2 * x})
DrawPath(0)
BeginLayer()
SetBlendMode(1)
repeat with i from 1 to 3
SetFillColor(item i of colors)
CirclePath(item i of centers, 1.3)
DrawPath(0)
end repeat
EndLayer()
EndFigure()
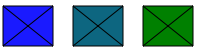
References bind a name (that you provide) with a group of graphical commands. Use them instead of repeating a given set of instructions.
You can store such named objects in a graphical context with BeginContext.
Making references
BeginGroup : All instructions between BeginGroup and EndGroup define a named group. Later you can reuse the drawing with UseReference(theName.)
BeginGroup(theName)theName : a string, the path's name
ExampleBeginFigure(0)
BeginGroup("envelope")
RectPath({3, 3, 50, 40})
MoveTo({3, 3})
LineTo({53, 43})
MoveTo({3, 43})
LineTo({53, 3})
DrawPath(3)
EndGroup()
SetFillColor({0.1, 0.1, 1})
UseReference("envelope")
SetTransformation({1, 0, 0, 1, 70, 0})
SetFillColor({0.05, 0.4, 0.5})
UseReference("envelope")
SetTransformation({1, 0, 0, 1, 70, 0})
SetFillColor({0, 0.5, 0})
UseReference("envelope")
EndFigure()
BeginPath : All path commands between BeginPath and EndPath define a named path. Later you can reuse the path with UseReference(theName). While BeginGroup defines a full drawing, BeginPath defines only a PDF path, but BeginPath is faster.
BeginPath(theName)theName : a string, the path's name
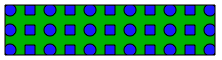
BeginPattern : All instructions between BeginPattern and EndPattern define a named pattern. Later you can reuse the drawing with SetFillPattern(theName) or SetPenPattern(theName.)
BeginPattern(theName, ClipRect, OffsetPt)theName : a string
ClipRect : a rectangle {x, y, width, height}, the pattern's boundary
OffsetPt : a point {x,y}, the pattern's periodicity
ExampleBeginFigure(0)
BeginPattern("rondetcarre", {0,0,40,20}, {40,20})
RectPath({0, 0, 40, 20})
SetFillColor({0, 0.7, 0})
DrawPath(0)
SetFillColor({0.1, 0.1, 1})
CirclePath({10, 10}, 6)
RectPath({25, 5, 10, 10})
DrawPath(3)
EndPattern()
SetPenColor({0, 0, 0})
SetFillPattern("rondetcarre")
RectPath({5, 5, 210, 50})
DrawPath(3)
EndFigure()
Using references
UseReference : Inserts a named graphic which was defined with BeginPath or BeginGroup. UseReference may invoke an object just defined in the same script, or a persistent object belonging to a graphic context available to it, which was defined before in a BeginContext ... EndContext wrapper.
UseReference(theName)theName : a string
SetPenPattern : Set the current stroke pattern to a named pattern. The pattern must have been defined before with BeginPattern. To recover a plain stroke color, use SetPenColor(rgba).
SetPenPattern(theName)theName : a string
SetFillPattern : Set the current fill pattern to a named pattern. The pattern must have been defined before with BeginPattern(theName).
To recover a plain fill color, use SetFillColor(rgba).
SetFillPattern(theName)theName : a string
Geometry commands.
Find more geometry commands in: File ▸ Open dictionary ▸ Scripting additions ▸ Geometry.osax. The "Geometric utilities" commands may be called outside of a drawing context.
Geometric utilities
AngleFromVect : Returns the angle between the horizontal and theVect, in radians.
AngleFromVect(theVect)theVect : a pair {dx,dy}
Det : Returns the determinant of thePt1 and thePt2.
Det(thePt1, thePt2)thePt1 : a pair {x, y}
thePt2 : a pair {x, y}
Norm2 : Returns the square of the norm of theVect, that is the sum of the squares of its coordinates.
Norm2(theVect)theVect : a pair {dx,dy}
Normalize : Returns a normalized vector parallel to theVect.
normalize(theVect)theVect : a pair {dx,dy}
ScalPro : Returns the scalar product of theVect1 and theVect2.
ScalPro(theVect1, theVect2)theVect1 : a pair {x, y}
theVect2 : a pair {x, y}
VectFromPoint : Returns the vector joining thePt1 to thePt2 as a list of the two coordinates.
VectFromPoint(thePt1, thePt2)thePt1 : a pair {x, y}
thePt2 : a pair {x, y}
InitUserTransformation : Compute the window's sizes {wi, he} and the transformation ut that can be used to map a drawing whose sizes in user's coordinates are given by theLimits into a window with sizes theDims (in units theUnits). If wantOrtho is true, the user coordinates are assumed to be orthonormal.
The result is {we, he, ut} and can be used to create a window with the properties {pageheight:he, pagewidth:wi}, and to call SetUserTransformation(ut)
InitUserTransformation(theDims, theLimits, wantOrtho, theUnits)theDims : a list of one or two numbers {width, height}. If wantOrtho is true, only the first number is taken into account.
theLimits : a list of four numbers {xmin, xmax, ymin, ymax}, the user coordinates
wantOrtho : a boolean
theUnits : a string ("", "mm", "cm", "pixels" or "inches"), theDims' units.
Exampleset {wi, he, ut} to InitUserTransformation({200, 200}, {-1,1,-1,1}, true, "mm")
set w to make new graphic window with properties ¬
{never save:true, name:"Sample", pagewidth:wi, pageheight:he}
BeginFigure(w)
SetUserTransformation(ut)
SetDisplayTransformation(ut)
CirclePath({0, 0}, 1)
SetCrossSize(10)
VertCrossPath({0, 0})
DrawPath(2)
TextMoveTo({0, 0})
DrawString("[b](0,0)")
TextMoveTo({0, 1})
DrawString("[b](0,1)")
TextMoveTo({1, 0})
DrawString("[l](1,0)")
EndFigure()
Path utilities
ArrowPath : Defines an arrowhead pointing towards the direction specified in radians. The extremity of the arrow is drawn at the current point. The extremity is shifted by the line width: prefer use DrawPath(0) (i.e. fill only) to draw arrows.
The image is an exemple of use of DrawPath("eofill")
ArrowPath(theAngle)ExampleIllustrate the use of DrawPath("eofill").
Drawn numbers are the winding number of each area (cf DrawPath description)
on DrawCircleArrows({x, y}, r)
MoveTo({x + r, y + 6})
ArrowPath(pi / 2)
MoveTo({x - 6, y + r})
ArrowPath(-pi)
MoveTo({x - r, y - 6})
ArrowPath(-pi / 2)
MoveTo({x + 6, y - r})
ArrowPath(0)
DrawPath(0)
end DrawCircleArrows
BeginFigure(0)
SetFillColor({0, 0.6, 0})
SetPenColor({0.1, 0.1, 1})
CirclePath({50, 35}, 30)
CirclePath({30, 40}, 18)
CircleArcPath({50,35}, 15, 0, 2*pi, false)
DrawPath(4)
SetFillColor({0.1, 0.1, 1})
SetArrowSize({7, 9, 4})
DrawCircleArrows({50, 35}, 30)
DrawCircleArrows({30, 40}, 18)
DrawCircleArrows({50, 35}, -15)
EndFigure()
CrossPath : Defines a x-shaped cross at thePt.
CrossPath(thePt)thePt : a pair {x,y}
VertCrossPath : Defines a +-shaped cross at thePt.
VertCrossPath(thePt)thePt : a pair {x,y}
SetCrossSize : Defines the size of the crosses in pixels.
SetArrowSize : Defines the shape of the arrowheads.
SetArrowSize({a, b, c}){a, b, c} : a: the point's length, b: the overall length, c: the half width. in pixels. By default {a, b, c} is {6, 10, 5}.
Text utilities
TextBox : Draws a string at the current text position using the current text settings and the current linear transformation.
Same as DrawString except that theString may include carriage returns. (An additional command to the standard PDF routines.)
TextBox(thePt, theString, theFont)thePt : a point (a list of two numbers) in pixels. Specifies the location of the center of the text block
theString : a string that may contain several paragraphs
theFont : a record e.g. {text font:"Arial", text size:9, justification:left} (justification is optional)
MeasureTextBox : Returns information regarding the size of the string. Accepts CR (ASCII 13) characters in theStr.
(Not a PDF primitive: you can use the command outside of any drawing context.)
The record returned contains the following fields: {width:w, height:h, lineheight:lh, descent:dy}
MeasureTextBox(theStr, theFont)theStr : a string that may be several paragraphs
theFont : a record e.g. {text font:"Arial", text size:9, justification:left, text spacing:3} (justification and text spacing are optional)
DrawNameWithDir : Draws a string at a given location with an offset in the direction specified.
DrawNameWithDir(phi, thePt, theString)phi : an angle in radians
thePt : a pair {x,y}
theString : a string
DrawnameWithCenter : Draws a string at a given location with an offset in the direction opposite to a given center.
DrawnameWithCenter(theCenter, thePt, theString)theCenter : a pair {x, y}
thePt : a pair {x, y}
theString : a string
HintFromDir : Returns the hint (as used for instance by DrawString) which corresponds best to the angle specified. For insance, π/2 would return "t".
HintFromDir(theRad)theRad : an angle in radian

 Wrappers